
Available after setup
Is Signals right for your team?
Teams that need understandable reports from their business data.
Upload a dataset, define the measures that matter and build a report with traceable source totals.
Request a Signals demoYour starting point
$149 / location / month
Monthly equivalent; $1,788 billed annually upfront. $0 one-time activation.
Start with a supported file or authorized connector. Check its last refresh and field definitions before using a report.
Growth includes Signals Lite for standard-source reporting and its listed executive dashboard. Standalone Signals, Momentum and Complete include the standard edition. Advanced modeling, premium reports, AI features and paid data are not included in these advertised plans.
Compare plans and allowancesFollow the work
From source to useful answer.
Advanced modeling, premium reports and AI features are separate licensed additions.
A closer look
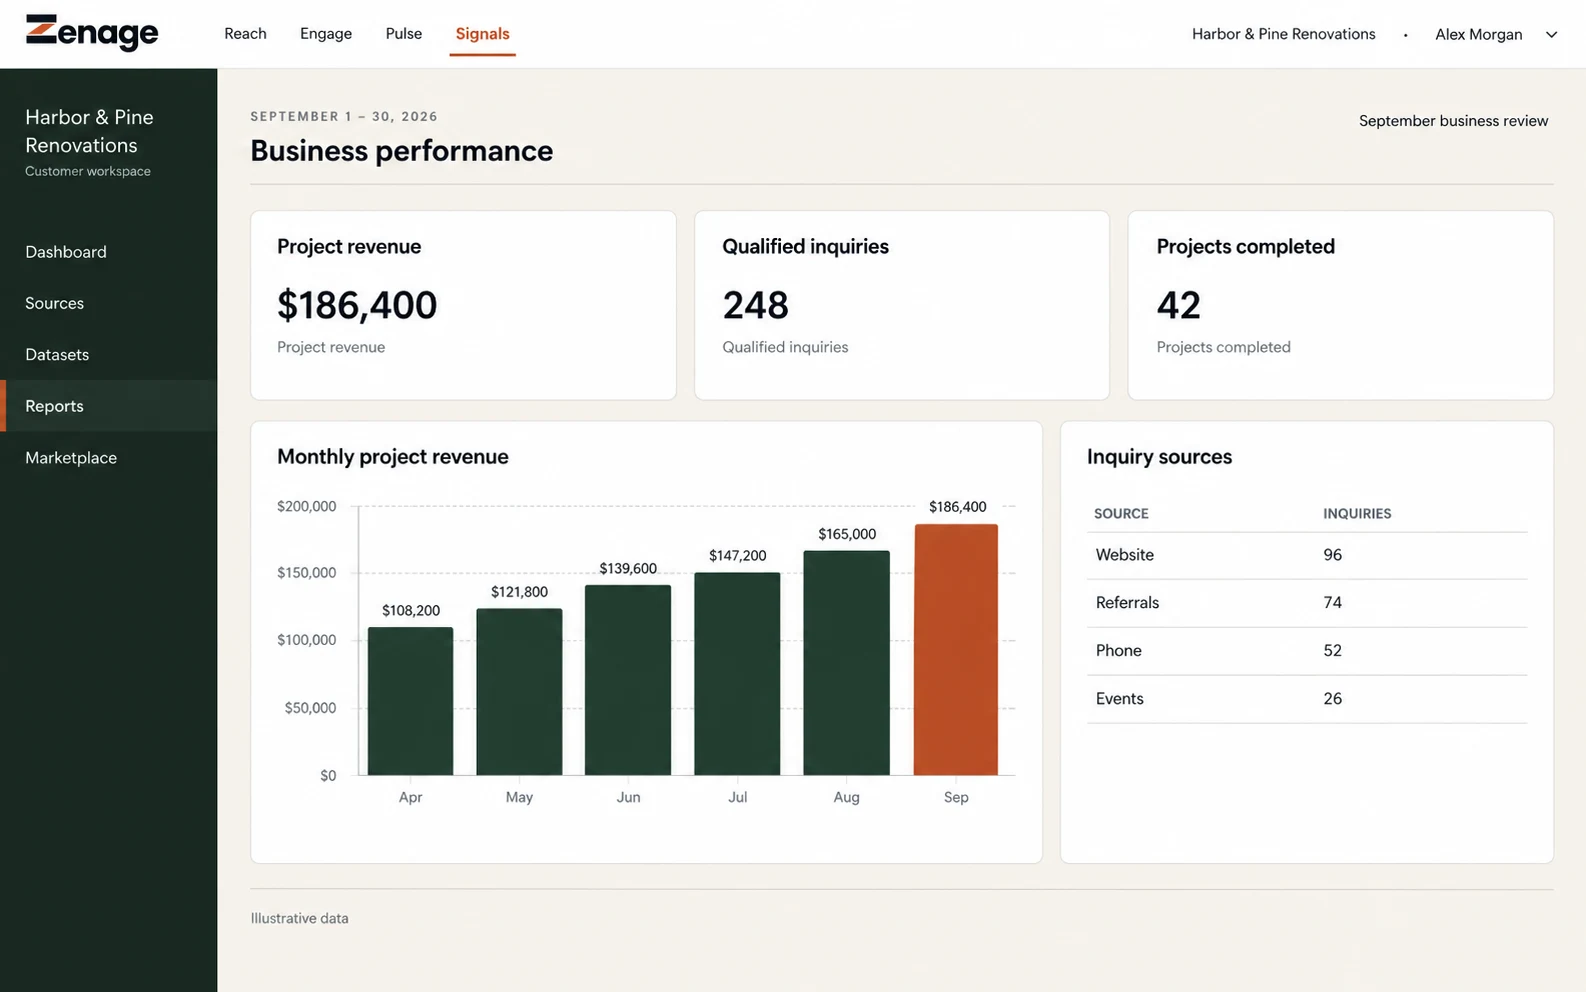
See the story behind your numbers.
- Dashboards built from your connected sources
- Source and freshness shown with each number
- Sharing that respects source permissions
What it does
Clarity that sits close to the work.
Getting set up
Four steps to your first dashboard.
- Connect a supported sourceStart with the data you already trust.
- Start from a templateOr build a report around your own question.
- Check the numbersConfirm where each figure comes from and how fresh it is.
- Share with your teamGive each person the access that fits their role.
Tools and connections
The tools around Signals.
Connection status depends on product access, account setup and provider permission. A listing is not a promise of a live connection.
What is the difference between Signals Lite and standard?
Growth includes Signals Lite for standard-source reporting and one executive dashboard. Standalone Signals, Momentum and Complete include the standard edition.
Are AI features included?
No. Advanced modeling, premium reports, AI features and paid data are not part of the advertised plans.
Can I add more data sources?
Yes. Advanced connectors start at $75 a month, plus any separately quoted third-party charges.